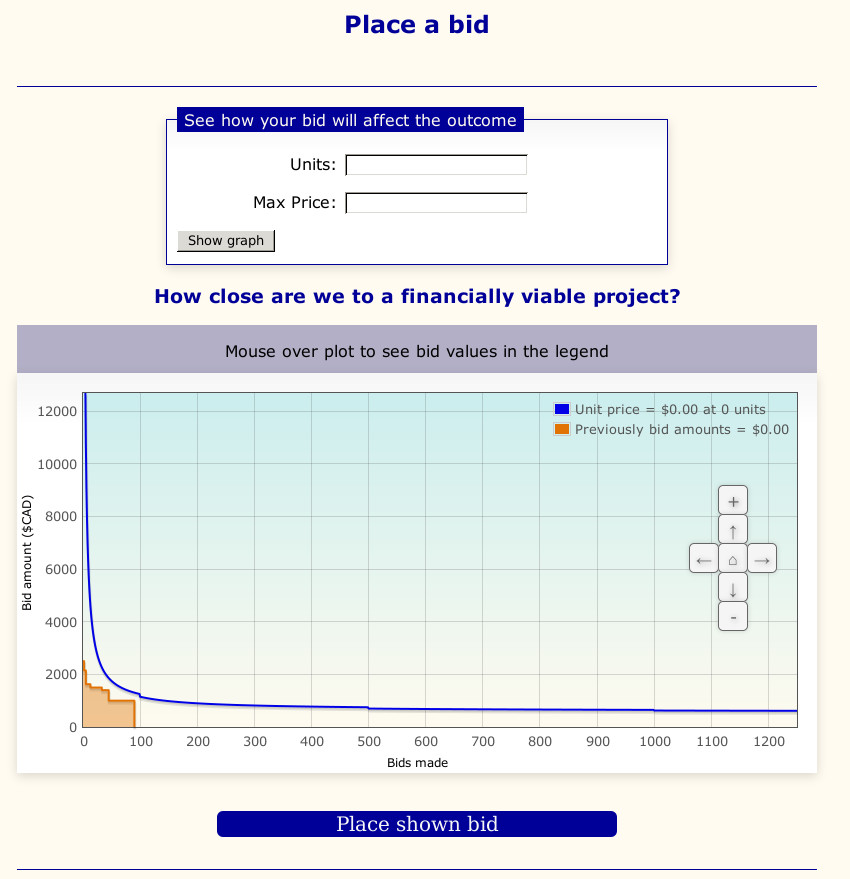
Once an Idea has hit the Bidding stage of development it will have a bidding page that looks like this:
There are two parts to the bid page, the bid selection, and the price curve.
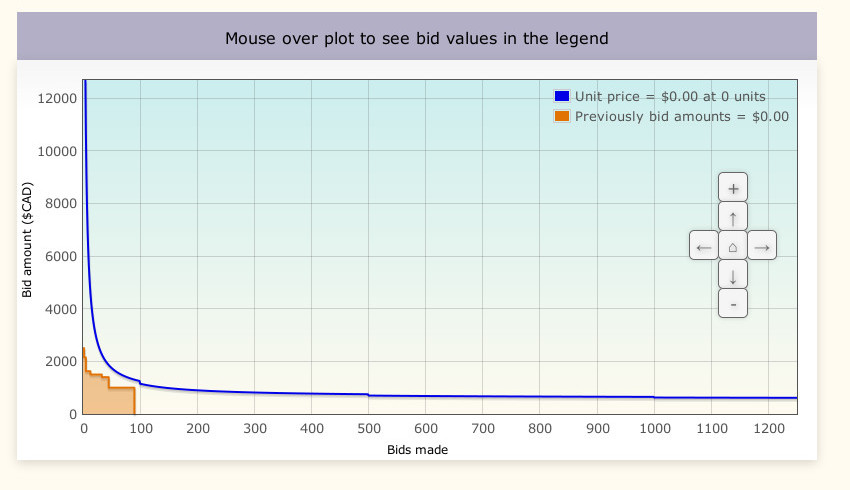
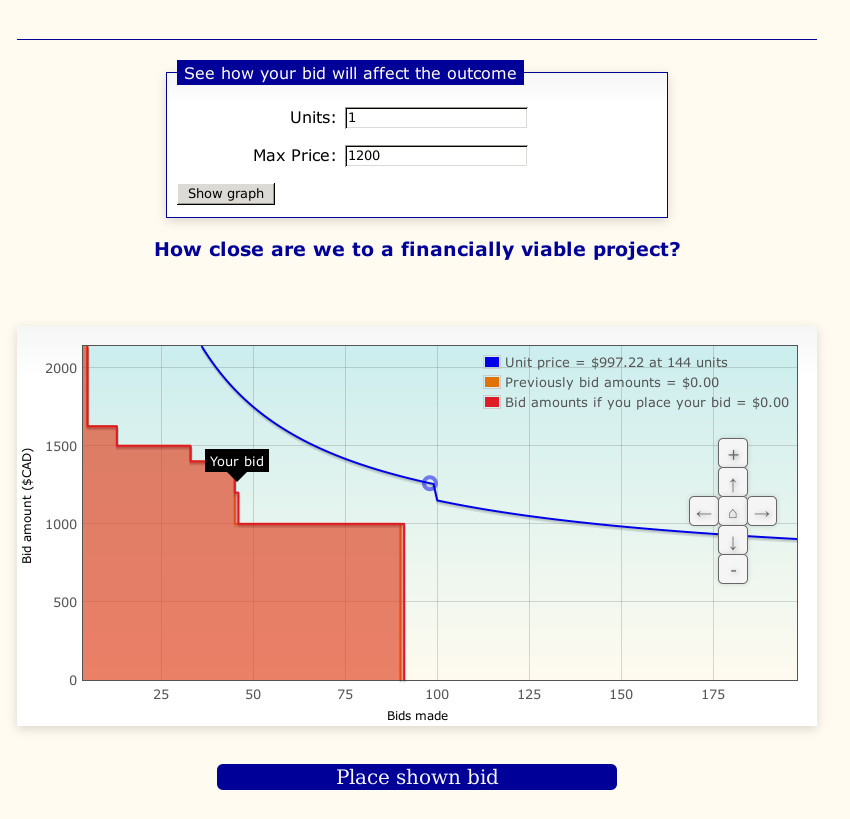
When you first see the price curve it has two important lines to it. The blue line represents the selling price of the project. The orange line represents the bids the project has received.
There is also a legend in the corner, which will display exact values at any point on the graph.
The first part of the plot is the price line. This is the blue single line going across the graph. This line represents the price per unit of the product. It goes down gradually as quantity increases because the cost to develop the product can be spread over more units. It also goes down in stages because the cost of materials often has discounts at particular order sizes.
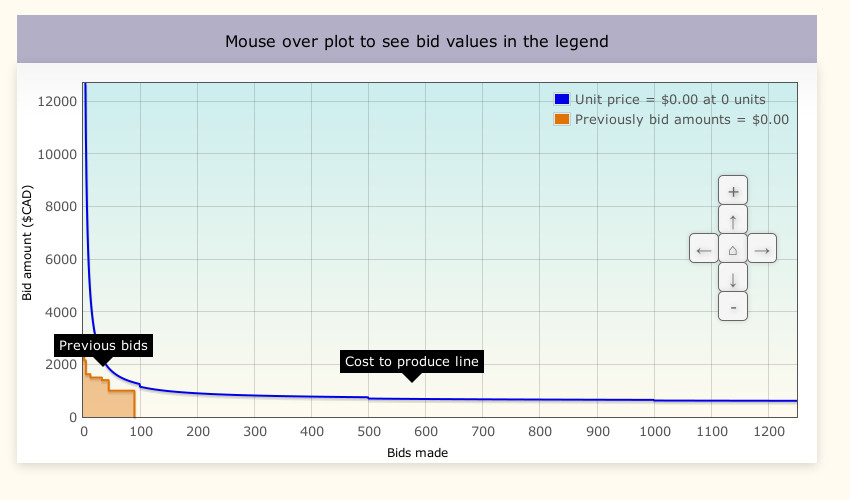
For example, in the preceding diagram, If only five units are sold our product will cost $10,750 each. Because many costs can be spread out over multiple units the cost quickly decreases as more orders are placed. So, if 25 units are sold, the price is only $2,750 each. Following the line along, It gradually decreases, with occasional sudden decreases like the one at 100 units that brings it down to $1150/unit.
Why do prices behave this way?
The next part to look at in the plot is the previously bid amounts. This is the shaded orange step graph. This graph shows how many units other people have bid to buy as well as the maximum price they are willing to pay. Note that this is not necessarily the price people would pay but the maximum they are willing to pay.
The orange step graph increases as more people place bids, and is arranged to show the largest bids first, decreasing down to the smallest bids. The aim is for the orange step graph to intersect the blue line, which would mean a funded project.
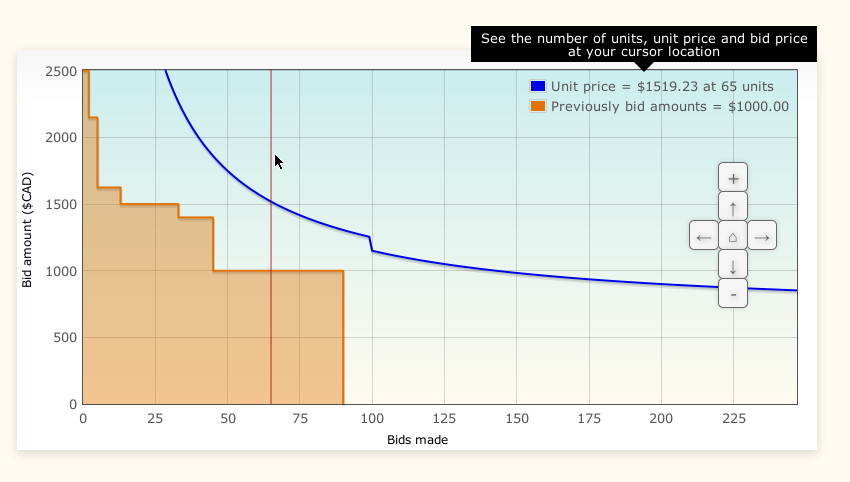
By moving your mouse onto the graph, you can see the exact value of the price at any number of units, as well as the lowest price value that has been bid if that many units have been bid on, in the corner legend.
You can also zoom or pan through the price curve with the arrows on the right, or by clicking and dragging to pan and using your center mouse wheel to zoom.
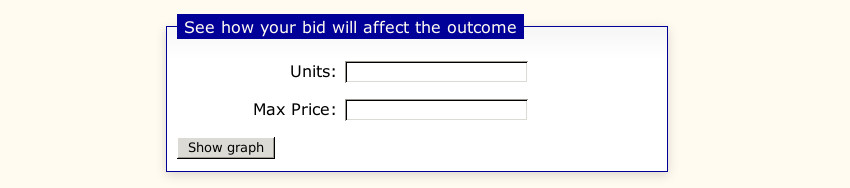
You can examine how a specific bid will affect the outcome of the project, and if it will help the project meet the threshold to begin development, using the bid selection section. In the top section, type in how many individual products you would like to have (Units), and the maximum you would be willing to pay for them (Max Price). Note: The maximum is not necessarily the amount you will pay, but bidding more may allow you to get the product faster.
You can now click the "Show Graph" button. This will not place your bid but will create a new line in the graph. The red shaded area will overlap the orange area, and show you what the bids placed will look like if you put your suggested bid in. This is read exactly the same as the orange previously bid line, but it includes the bid you are looking at.
You can change your maximum price or number of units as many times as you like to see the change. Once you are satisfied you can place your bid.
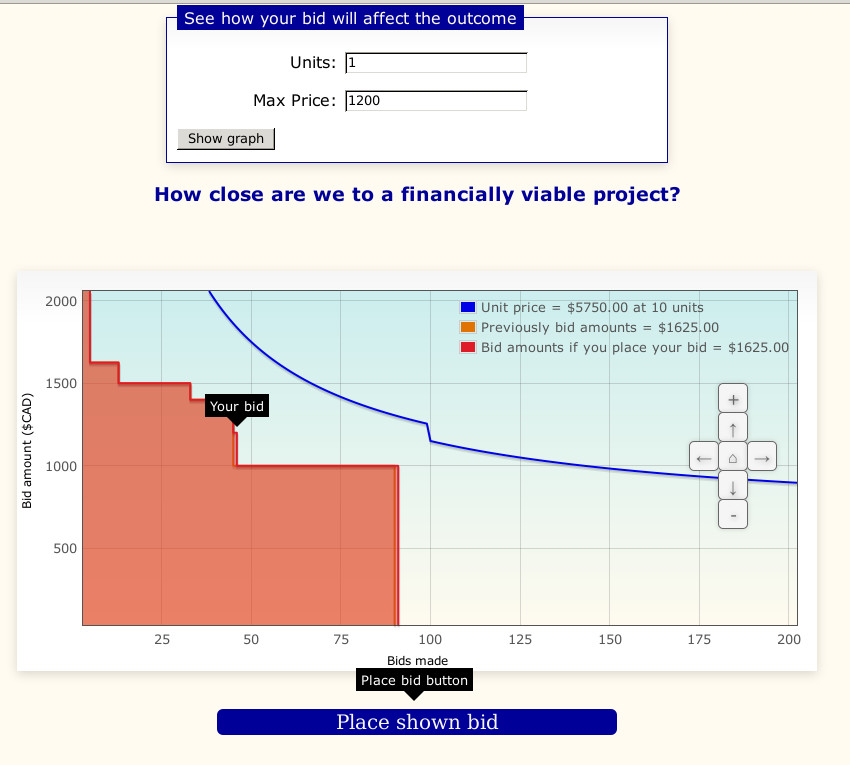
Once you have found a bid you are comfortable with, it you can promise to purchase the units. To place a bid, you must be logged into the CoDesign forum. If you are already logged in, simply hit the "Place shown bid" button to bid the amount you tested most recently. If you are not logged in, click on the "Log in" button and log in with your forum user name and password. After you can return to the page again and place your bid.
We do not charge you, or even ask for a credit card until the project has hit a point we will start development. At this point general communications will be done over email. We will never entrust your credit card details to email.
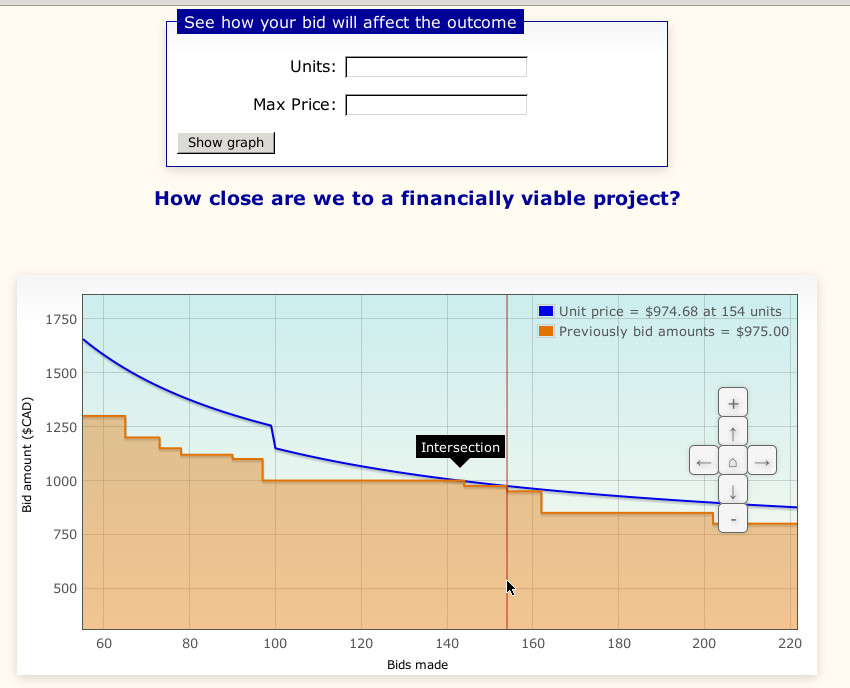
In simplest terms, a project is funded when the bid curve intersects the unit price curve. This means that enough people have promised to buy the product at at least the price required to do all the development and produce the units that have been purchased.
In the above graph, you can see that two intersections actually take place; one where the arrow is pointing at 144 units, and another where the cursor is at 154 units. You can verify it truly is an intersection by looking at the legend, where the previously bid amount is higher than the unit price, though only slightly.
In the event of two or more intersections, like the above example, we will use the lowest-priced one, as it gives more people an opportunity to obtain the product, and has a lower price for everyone.
All 154 people that bid on the project at $975 or more will now get a final product for only the $975 intersection price, and not their higher bid price. As bidding continues, their price may drop even lower.
Bids to the right of the intersection are too low to secure a unit in the first batch. Once the project is funded, these bidders will be sent an email. They may choose to increase their bid to the funded price, to be sure of receiving a unit.